
By John Helmer, Moscow
And now for a Classical breather.
According to the Greek myth, Orion was a giant hunter who could walk across the Mediterranean. One evening he pulled one of those drunken turns that give dinner parties a bad name – he tried to make a dessert out of the daughter of his host, Oenepion. So Oenepion stuck the cheese-knife into Orion’s eyes, chucking him out of the dining-room and off his island. At that point, Hephaestus, the god of high technology (blacksmithing at the time), took pity on the big boy, and gave him a small one, Kedalion, to stand on his shoulders and guide him eastwards, where eventually, the sun healed Orion’s eyesight. He then re-marched westward for revenge against Oenepion.
Despite the unmitigated nastiness of the original tale, the pretty idea that a dwarf can see further than the giant on whom he depends got a run from Isaac Newton as a metaphor for the future sitting on the shoulders of the past, academically speaking.
A report issued today by Renaissance Capital analyst Dr Ivan Tchakarov makes the case that Russia’s oligarchs are just as disproportionately overweight and rapacious as they were at their first asset grab, the loans-for-shares scheme of 1995; and that the dwarves on their shoulders can do no better in the foresight or asset departments after sixteen years.
Here’s the punchline: “we find that… years of prosperity have not made a dent in income inequality, which has stayed broadly constant during 1995-2011… The most recent Forbes list of billionaires does not refute this notion. Russia now has 101 billionaires, trailing China by only 14, while the US tops the list with 412. Although the relative positions of the US and China could be justified by their status as the two largest global economies, Russia’s third place seems at odds with its 10th place globally in terms of GDP. Similarly, while Russia’s billionaires account for 8.3% of all billionaires, its share in global GDP is only around 2.5%.”
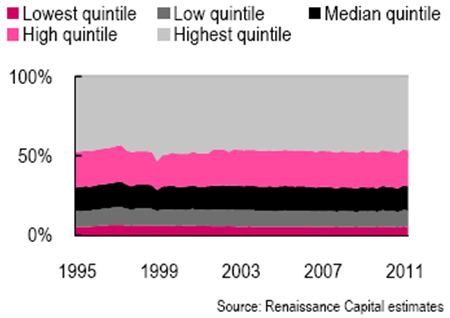
Starting in 1995 – omitting the precipitous decline of income equality at the Yeltsin power grab in 1991 – the chart shows how stable the Russian political system has been in terms of delivering income, or loss and lack of income, to the population countrywide. “One would have expected that the intra-crisis period (1999-2007) of very robust growth and double-digit increases in real incomes should have brought about a sizeable reduction in income inequality. However, this is not the case and income distribution has, in fact, remained broadly constant. For example, the share of income commanded by the top 20% of households has hovered at around 46-47%, while that of the bottom 20% of households has stayed around 5-6%.”
On the evidence, the busts of 1998 and 2008 have turned out to pay better returns for the oligarchs than the booms which preceded the busts. It looks as if the oligarch business model of transfer pricing, asset stripping, over-leveraging, administrative concentration, and safe-haven hoarding of wealth, protected by state bailouts, has been a bigger success than any other model attempted since 1991:
Occupationally – if you define entrepreneurial activity in juxtaposition to regular salaried work, or as the relative capacity to avoid income taxation – the dwarves have been going blind, and there are fewer giants. “The share of overall income which Russian households derive from entrepreneurial activity has fallen from 15% in 1998 to 9% at the end of 2010. While the decline accelerated during the crisis at the expense of a rising share of income being derived from social transfers (as government sought to complement thinning household incomes), this trend has been a more persistent one.”
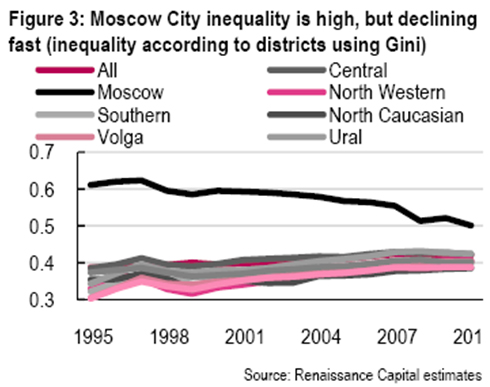
The one slight improvement in income distribution which the RenCap report identifies is a regional effect:
That leaves the one measure of income distribution that is of no relevance at all to Russians – how they compare with the rest of the world.

“We use the best known measure of income inequality, the Gini coefficient, to gauge the statistical dispersion in income distribution in Russia vs other countries (Figure 1). The Gini coefficient is between 0 and 1, with 0 pointing to perfect equality and 1 to perfect inequality. As income inequality may simply reflect different levels of income, we plot it against countries’ GDP per capital levels at market exchange rates. The general rule seems to be that richer countries are, on average, less income-unequal. Russia is broadly in line with the average relationship, considering its wealth, the level of income inequality is far from excessive. In the BRIC universe, Russia is only marginally more income-unequal than China and India, but far better placed than Brazil.”
The hint here is that Russian GDP growth, no matter how fast or how slow, will not mean improving income equality for Russians, although it is likely to do so elsewhere. It’s looking like Orion gets his dessert in the end, and Kedalion will be obliged to feed off crumbs from Oenepion’s table.